The CRISPR/Cas9 system has revolutionised scientific research over the last few years, offering an efficient method of genome editing. CRISPR/Cas9 utilises the cellular machinery used by bacteria to recognise and edit the DNA of invading viruses. It is formed of two key components: Cas9, an enzyme that can cut a double DNA strand at a precise point; and CRISPR, a short strand of RNA that guides the Cas9 enzyme to recognise and cleave at specific DNA sites.

Cas9 restricts DNA at specific Protospacer Adjacent Motifs (PAMs), which is species-dependent (for example, 5′ NGG 3′ for Streptococcus pyogenes Cas9). Therefore, by coupling a custom CRISPR polymer (gRNA), Cas9’s restriction activity can be targeted to specific locations in the genome that contain a PAM region.

The latest release of Ensembl (Ensembl 85, July 2016) now includes annotated CRISPR/Cas9 sites predicted by the Wellcome Trust Sanger Institute Genome Editing (WGE) group for human and mouse genomes.

The WGE group have predicted CRISPR sites and developed an accompanying database to help you design genome editing experiments, and you can view these WGE-predicted sites by adding the ‘WGE CRISPR sites’ track to any ‘Region in Detail’ view for human or mouse in Ensembl. Click on the ‘Configure this page’ option from the menu on the left hand side of the page, and then add the track, which Configure this page buttoncan be found in the ‘Other regulatory regions’ category, by clicking the empty box and selecting the track style from the pop-up window:Add CRISPR track option

Below, you can see an example of the WGE-predicted CRISPR site track added (to both the forward and reverse strand) of the genomic region containing the human BRCA2 gene in the ‘structure’ style. Each CRISPR site is labelled as a single green box, which appears as a single vertical line when viewing a large genomic region.CRISPR site track

From the example above, we have now zoomed into a specific region of interest. You can see the structure of each CRISPR site, with the filled green box matching up with the PAM motif and the un-filled box representing the potential gRNA binding sequence. Clicking on any of these individual CRISPR sites will open a pop-up window that provides you with more information about the specific genomic co-ordinates of the CRISPR site as well as a link to the WGE database.CRISPR pop up

You can find more information about the CRISPR site prediction method in the published description of the WGE database

What’s New in e85:

  • 30 new human epigenomes from the Roadmap Epigenomics Project
  • Human and mouse: Updated GENCODE set; including manually annotated HAVANA annotation, and all CCDS genes 
  • Imported symbol names from the Vertebrate Gene Nomenclature Committee (VGNC) for Chimpanzee
  • Improved highlighting options in the Location View for Userdata and Tracks
  • Wasabi Tree viewer

30 New Epigenomes from the Roadmap Epigenomics Project

Roadmap Epigenomics is producing epigenomic maps for stem cells and primary ex vivo tissues selected to represent the normal counterparts of tissues and organ systems frequently involved in human disease. In Ensembl 85, we have run our regulatory pipeline on Roadmap Epigenomics data for 30 cell/tissue types.

Additionally, the peak calling component of the Ensembl Regulation Sequencing Analysis pipeline has been improved. All of the existing ENCODE and BLUEPRINT data in Ensembl’s Regulation database have been reprocessed.

Human Gene Set Update and New Assembly Patches

The human gene set now corresponds to GENCODE 25 and the assembly has been updated to include new assembly patches for GRCH38.p7

VGNC Symbols for Chimpanzee

We now import symbol names from the Vertebrate Gene Nomenclature Committee (VGNC) for Chimpanzee. VGNC is an extension of HGNC for standardising naming across vertebrates lacking a nomenclature committee by transferring gene symbols from human to known orthologues. This replaces our own system for naming chimpanzee genes. This has improved our naming of chimpanzee genes as seen in POMGNT2, which was previously named GTDC2 in Ensembl 84.

Userdata and Track Highlighting

We have updated the highlighting functions in Location View:

  • User data Highlighting – When you upload your own data to Ensembl the newly uploaded track will be automatically highlighted. This highlighting will disappear when you hover your cursor over the track
  • Highlight track on hover – When placing the cursor over any track, the whole width of the track will be highlighted
  • Track menu Highlight Icon –  Track menu now contains an icon that allows you to manually turn highlighting on/off

track-click-menu

Wasabi Tree Viewer

Wasabi has replaced Jalview as a way to view gene trees and multiple alignments. Clicking on any node within the gene tree will give you the option to ‘View in Wasabi’. 

wasabi-menu-option

Clicking on ‘View in Wasabi’ will open a pop-up window with the tree and alignment:

wasabi-output

Other News

  • Updated Ensembl-Havana rat gene set; a merge of complete Ensembl gene models and the latest Havana gene annotation
  • Human and mouse CRISPR sites, predicted by Wellcome Trust Sanger Institute Genome Editing (WGE) have been added
  • Human and mouse databases have been updated to dbSNP147 and dbSNP146 respectively
  • Phenotype data updated for several species, including human, mouse, pig and chicken
  • GTEX eQTL data for 14 human tissues has been added to the Gene Regulation view
  • The Allele Frequency Calculator has been migrated from the 1000Genomes website to our GRCh37 archive. This tool takes a VCF file and a matching sample panel file, and calculates allele frequencies for one or more 1000G populations for a defined chromosomal region
  • New tool: File Chameleon customises files from the Ensembl FTP server. Current functions include; adding ‘chr’ to your chromosome names for use with UCSC’s genome browser and removing long genes

A complete list of the changes can be found on the Ensembl website

Find out more about the new release and ask the team questions, in our free webinar: Wednesday 27th July, 4pm BST. Register here.

Continued HapMap variation data access through Ensembl

NCBI have recently released plans to immediately retire their HapMap interface, however, data from the HapMap Project will continue to be freely accessible through Ensembl. There is lots of help and documentation as well as video tutorials to help you learn how to access variant data in Ensembl. This post aims to complement those materials to highlight the methods for accessing the HapMap Project variant data specifically.

Finding HapMap variants by ID

You can find data from the HapMap project relating to specific variants by searching for the variant rsID itself. In Ensembl, you can find information related to variants identified in the HapMap Project, which includes population genetics statistics:Population Genetics HapMap

However, as you can see from the example above, some of the populations represented in the HapMap Project have two separate entries in the Population Genetics table. This is because the HapMap Project was completed in a number of phases. In the first phase, a number of different groups used different genotyping platforms to type variants from a number of population panels (CEU, YRI, HCB, JPT). In a later phase, a larger set of samples were added to the samples from the initial phase and submitted as HapMap3. The two entries refer to the two submitted phases of the HapMap Project, where the number in brackets next to the allele frequency indicates the number of samples in that population.

It is also possible to view HapMap Project results by gene of interest by searching the Variant Table. The Variant Table can be filtered by ‘Evidence’ type so you can choose to see only HapMap Project variants, for example.Variant Filter HapMap

Filtering the Variant Table by ‘Evidence type = HapMap’ will filter the displayed variants to those identified in the HapMap project. This will be denoted by theevidence HapMapin the Evidence column.Filtered variant Table Hapmap

Finding HapMap Project variant data using BioMart 

HapMap SNP data can also be retrieved using BioMart. There is help and documentation and a video tutorial to help you while using BioMart.

When querying the Homo sapiens short variants dataset in BioMart, you can access HapMap variant data specifically by using the ‘Variant Set Name’ filter and selecting the HapMap populations that are relevant for your research.HapMap variation Mart

Finding HapMap variants using the Ensembl API

It is also possible to access variation data through the Ensembl APIs. Using the Perl API, for example, it is possible to retrieve variation data specifically related to the HapMap Project variant set, either as the whole HapMap variant set, or as individual populations represented in the HapMap Project.

Please note that the archive websites for Ensembl releases 71 (April 2013) and 72 (June 2013) will be retired in July when version 85 is released.

This is in accordance with our rolling retirement policy, whereby archives more than three years old are retired unless they include the last instance of the previous assembly from one of our key species (human, mouse and zebrafish).

For more information about how to use archives, please see our previous blog post on the topic; a list of all current archives is available on the main website.

Ensembl 85 is scheduled for July 2016, highlights include:

Updated gene sets and annotations

  • Human: updated to GENCODE release 25, new CCDS import
  • Mouse: updated to GENCODE release M10,
  • Rat: updated Ensembl/HAVANA gene set
  • Vega 65 annotation added for human, mouse and rat
  • C. elegans gene set and other annotations updated from WormBase release WS250
  • Zebrafish: new development and tissue-specific RNA-seq tracks
  • Armadillo/Dog/Ferret: new lincRNA models

Variation data imports and updates

  • dbSNP updates for human (v147) and mouse (v146)
  • COSMIC v77 data update
  • New and updated structural variant studies from DGVa for human and dog
  • Updated phenotype data for several species, including; human, mouse, rat, zebrafish and cat

Regulation data

  • 23 new human epigenomes from the Roadmap Epigenomics Project
  • ENCODE and BLUEPRINT data reprocessed with improved peak-calling pipeline

New web features

  • Track highlighting for newly displayed tracks and on hover-over
  • Summary information from SNPedia is included on Variation Summary pages
  • Wasabi will replace Jalview for gene trees and multiple sequence alignment visualisation
  • Web code for session records will be migrated to use Rose ORM

For more details on the declared intentions, please visit our Ensembl admin site. Please note that these are intentions and are not guaranteed to make it into the release.

A mysteriously common debilitating genetic disorder. A deadly tropical disease. One of my favourite stories in the history of genetics weaves together these two elements – it’s a good one and it always deserves a re-telling – that of malaria and sickle cell anaemia.

This story captures my attention and inspires me in the power of scientific observation, curiosity and experiment. I’m sure you are all aware of the details of this worn-out tale: it is used as an example in classrooms and lecture theatres every year to explain Mendelian genetics, haploinsufficiency, physiology, disease and protein structure and function to young scientists. To mark the coincidental coinciding of DNA day and Malaria day, we wanted to re-visit this ‘historical’ example of how scientific observation and experimental approaches have led to the understanding of how a disease as debilitating as sickle cell anaemia paradoxically persists in the human population.

Molecular biology and bioinformatics have transformed the face of biological research over the last few decades. The speed that scientists can sequence and analyse DNA means that global collaborations that study thousands of individuals are beginning to shed light on a range of different diseases.

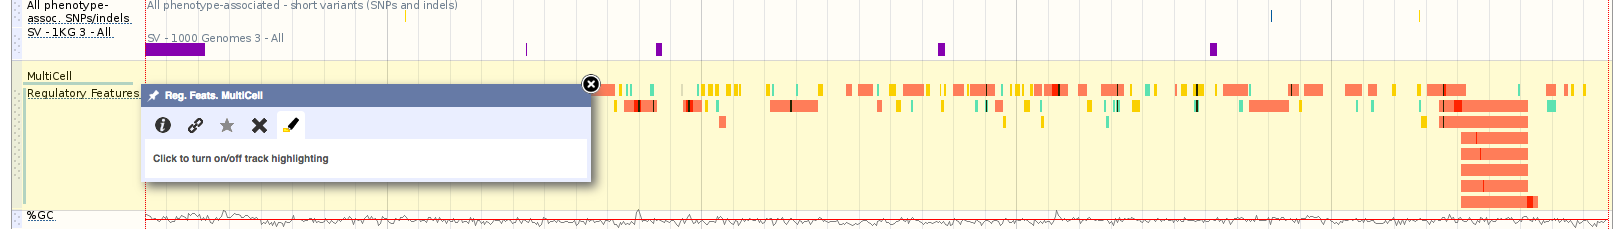
Sickle-cell anaemia is a disease in which red blood cells form an abnormal crescent (or sickle) shape. It is an inherited disorder, and was the first ever to be attributed to a specific genetic variant (rs334, see it here in Ensembl).

rs334_info

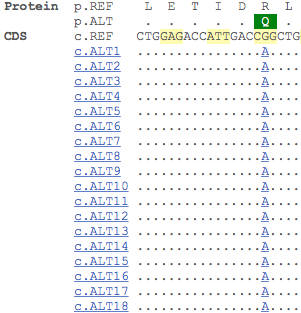
In 1949, ‘Sickle Cell Anaemia, a Molecular Disease’, from Pauling et al. identified a difference in the electrophoretic mobility between haemoglobin from healthy individuals and those with sickle-cell anaemia caused by a change in molecular structure of haemoglobin responsible for the sickling process [1]. The genetic variant (A, Reference:T) that causes cell sickling results in the substitution of a conserved glutamic acid residue at position 7 in beta chain of haemoglobin to a valine [2].

You can find this information in the Genes and regulation section for this variant. In the table below, which has been filtered to see only missense variants, the ‘Allele (transcript allele)’ column describes the variant allele (A) and the  transcript allele (T, as the HBB gene is located on the reverse strand). You can also see the nature and location of the variant on the transcript in the ‘Position’, ‘Amino acid’ and ‘Codons’ columns. The SIFT and Polyphen algorithms predict the effect of the amino acid change on protein structure and function. Interestingly, only the SIFT algorithm predicts that the T/A variant would have deleterious effect on haemoglobin structure and function, confirming that predictions can never be as accurate as experimental evidence.

rs334_consequences

Only those individuals that are homozygous for the variant allele develop sickle cell anaemia, although heterozygous individuals do have the much more manageable sickle cell trait. If untreated, individuals with sickle cell anaemia have a shorter than normal life expectancy, experiencing lethargy and breathlessness throughout their lives, with increased risk of stroke and pulmonary hypertension, as well as increased vulnerability to infection. Individuals with the milder sickle cell trait can experience problems in low oxygen or as a result of severe physical exercise, but can mostly be expected to live normal lives.

As such it would be expected that this variant would be rare in human populations. However, observations made in mid-20th century revealed that this variant is, in fact, surprisingly common in African, African American and Caribbean populations (you can see this in the 1000 Genomes allele frequencies available under Population genetics in Ensembl). Coincidentally, these were people descended from those who came from areas where malaria is prevalent [3]. Why was this happening?

rs334_pop_genetics

Individuals carrying just one copy of the variant allele were known not to develop sickle cell anaemia, leading rather normal lives. However, it was found that these same individuals, were in fact highly protected against malaria. It turned out that, quite bizarrely, having alternate alleles at this loci simultaneously prevented infection from the malaria parasite with entirely manageable sickle manifestations! Therefore, individuals with one copy of each allele have a greater chance of survival in geographical areas where malaria is endemic, preserving both alleles in the population.

Understanding this relationship has led to a deeper understanding of the infective lifecycle of the malaria parasite and novel approaches in combating malaria [4-5], but also an appreciation of the genetic factors leading to sickle-cell anaemia.

This story exemplifies how observation, epidemiology and scientific investigation can uncover the mysteries of a human disease and provide important insights for its treatment. Nowadays, this gold standard of studying single genetic disorders has been multiplied and sped up on an unprecedented scale. There are now numerous projects that are aimed at sequencing the DNA of many individuals with different diseases and using the power of bioinformatics to analyse how genetic variation might lay at the foundations for previously poorly understood diseases.

[1] Pauling L. et al. Sickle cell anemia a molecular disease Science, 1949 Nov 25;110(2865):543-8

[2] Ingram VM et al. Abnormal human haemoglobins. III. The chemical difference between normal and sickle cell haemoglobins Biochim Biophys Acta 1959 36: 543–548

[3] Allison AC et al. Protection Afforded by Sickle-cell Trait Against Subtertian Malarial Infection 1954 Br Med J 1 (4857): 290–294

[4] Mounkaila A. et al. Sickle Cell Trait Protects Against Plasmodium falciparum Infection American Journal of Epidemiology, 2012 176 175-185

[5]  Gregory LaMonte et al. Translocation of Sickle Cell Erythrocyte MicroRNAs into Plasmodium falciparum Inhibits Parasite Translation and Contributes to Malaria Resistance Cell Host & Microbe, 2012 12 187-199


We have scheduled the next releases of Ensembl (Release 85) and Ensembl Genomes (Release 32) for July 2016. Details of the declared intentions will be announced nearer the time.

Please contact the helpdesk if you have any questions or feedback.

What’s new in Ensembl Genomes 31?

There are legs and tentacles everywhere in this release of Ensembl Metazoa, as ten new species scuttle, swim and slither into our databases. From the Antarctic midge to the California two-spot octopus, the new species illustrate the diversity of metazoa. Our new Metazoan species also include dog and rat parasites (the itch mite and a nematode), as well as species that pose significant problems for agriculture (Australian sheep blowfly) and aquaculture (the salmon louse and a myxosporean). The common bumblebee is an important pollinator, a brachiopod represents a new phylum in Ensembl Metazoa, while the African social velvet spider is a fascinating model of sociality and is the first spider in Ensembl Genomes.

Belgica_antarcticaBombus_impatiensLingula_anatinaLucilia_cuprinaOctopus_bimaculoidesSarcoptes_scabieiStegodyphus_mimosarumStrongyloides_rattiLepeophtheirus_salmonisThelohanellus_kitauei

Not to be outdone, Ensembl Protists is now updated to 158 genomes from 104 species and Ensembl Bacteria has been updated to include the latest versions of 39,584 genomes (39,183 bacteria and 401 archaea) from the INSDC archives.

Other news

Fungi: Updated annotations based on PHI-base 4.0 have been included. New variation data for Schizosaccharomyces pombe.

Protists: Addition of 4 protist species for pan-taxonomic comparative analysis (Monosiga brevicollis, Thecamonas trahens, Cryptomonas paramecium and Chondrus crispus), meaning that Ensembl Compara now includes protists from all the major Eukaryotic clades.

Plants: There are now 350,000 new rice variations across 3,000 rice accessions from 89 different countries as well as track hubs for more than 900 public RNA-Seq studies, totalling more than 16,000 tracks across 35 different plant species.

MetazoaUpdated gene sets for the leaf cutter antred fire ant and the two-spotted spider mite as well as updated gene sets from VectorBase and WormBase.

Check out all the changes on our Ensembl Genomes website.

Any questions or comments? Email us.

What’s new in e84:

  • Human: Incorporation of BLUEPRINT Epigenome data and methylation data
  • Pairwise Linkage Disequilibrium (LD) calculation on LD variant page
  • Track hub registry interface
  • Transcript haplotype view

Incorporation of BLUEPRINT Epigenome data

BLUEPRINT is a large scale research project aimed at deciphering the epigenome of blood cells. ChIP-seq and DNase hypersensitivity data from the BLUEPRINT project has now been incorporated into Ensembl. All of the cell types analysed in the BLUEPRINT project are listed here. In Ensembl 84, we are including BLUEPRINT data for the following 20 independent cell types, divided based on cell lineage and tissue source:

CD14+ CD16- monocyte from Venous Blood
CD14+ CD16- monocyte from Cord Blood
CD4+ ab T cell from Venous Blood
CD8+ ab T cell from Cord Blood
CM CD4+ ab T cell from Venous Blood
eosinophil from Venous Blood
EPC from Venous Blood
erythroblast from Cord Blood
HUVEC prol from Cord Blood
M0 macrophage from Cord Blood
M0 macrophage from Venous Blood
M1 macrophage from Cord Blood
M1 macrophage from Venous Blood
M2 macrophage from Cord Blood
M2 macrophage from Venous Blood
MSC from Venous Blood
naive B cell from Venous Blood
neutro myelocyte from Bone Marrow
neutrophil from Cord Blood
neutrophil from Venous Blood

This data can be viewed alongside other tracks in Ensembl by using the ‘Configure this Page’ option and selecting your cells of interest.  configure this pageBLUEPRINTex2

Pairwise LD calculation

You are now able to calculate linkage disequilibrium (LD) between any two variants in Ensembl. To calculate the r2 and D’ values for LD between two specific variants, enter the ID of any variant into the LD calculation text box on the specific page of the reference variant. This feature can be found by clicking on ‘Linkage Disequilibrium’ from the menu on any variant page.

LDcalc2

Track Hub registry interface

With the arrival of the new Track Hub Registry, we have added a feature that allows you to search for track hubs of interest and attach them directly to Ensembl. Just click on the ‘Add your data/Manage your data’ button on any Ensembl page, and select ‘Track Hub Registry Search’ from the lefthand menu. manage your dataTrackHubRegistryInterface

The interface will only search for hubs that have assemblies available for the site you are on; to see the full range of species and assemblies, visit the Track Hub Registry site directly.

Transcript haplotype view

The transcript haplotype view is a new data view we have implemented that allows you to explore observed transcript sequences that results from variants identified from resequencing data from the 1000 Genomes Project. By clicking on the ‘Haplotypes’ link on any transcript page, you are able to view protein consequences, population frequencies and protein alignments of all the haplotypes for that particular transcript.

Transcript_haplotype_view Screen Shot 2016-03-02 at 11.01.34Screen Shot 2016-03-02 at 11.02.04

Other news

  • Mouse: update to GENCODE M9 annotation
  • Zebrafish: updated gene set, including manually annotated HAVANA annotation
  • Baboon: lincRNA model update
  • Latest sequence variants from dbSNP build 146 for human, cow and dog
  • Import of COSMIC 75 cancer data
  • New and updated studies from DGVa for several species such as human, mouse, zebrafish, macaque, cow and dog
  • Gene trees: new option to prune by target species/ taxon in the REST API
  • Ensembl Families now defined by an HMM library, based upon the Panther database.
  • Alignments in CRAM format
  • DAS support ended
  • Regulatory segments retired from the Ensembl regulation BioMart, but now available in bigbed format through the ftp site

A complete list of the changes can be found on the Ensembl website.

Find out more about the new release, and ask the team questions, in our free webinar. Wednesday 16th March, 4pm GMT. Register here.

Do you want to learn more about the Ensembl browser? Are you unable to host or attend an in-person Ensembl workshop? Do you still want to learn in real-time with instructors on hand to help you out?

The new Ensembl online training series might be for you.

What is it?

The Ensembl online training series consists of a series of live webinars, once a week over seven weeks. In each webinar you will learn about a specific aspect of Ensembl data or tools – see the online course for details. You will then have access to exercises so that you can practice what you’ve learnt.

You can dip in and out of webinars, taking only those that interest you. If you miss one, we will post the videos to our YouTube channel and embed them in the online course so that you can catch up.

What makes it special is that the course is fully interactive. If you attend the live webinars, you will have an opportunity to ask the instructors questions in real time. Afterwards, while you work on the exercises, you can interact with the instructors and other participants via our dedicated Facebook group. If you prefer not to use Facebook, you can also email us for help. Plus, you’ll be able to re-watch all or part of the videos at your leisure.

When is it?

We start on the 24th March, and will hold seven webinars on Thursday afternoons, up until the 5th May. The live webinars will take place at 4 pm British time (GMT before 27th March, BST after 27th March), but if you are unable to attend live, the videos will be posted shortly afterwards.

After the live course finishes, we will leave the full course of recordings and exercises online, so that you can take it independently whenever you choose.

How do I sign up?

You can visit the course pages to see what’s going on without signing up. If you want to attend the webinars live, you will need to sign up, but there’s no charge for doing so. You may also wish to join the Facebook group.