
As part of Ensembl 85, we are excited to introduce expression quantitative trait loci (eQTL) data, through our partnership with the Genotype-Tissue Expression (GTEx) project.
The GTEx project has the goal of identifying the influence of genetics on tissue-specific gene expression, i.e. to map correlations between genotype (SNPs) and gene expression levels (RNA-seq). eQTLs are variants which are found to be significantly correlated with differences in gene expression. Though still in its infancy, we hope that in time this type of data will allow us to conclusively determine the link between regulatory features and their gene targets.
Thanks to our use of HDF5 technology, we offer the only rapid look-up service across all GTEx SNP-gene association tests. We have included all of the correlated variants, including those that fall short of the significance threshold. The GTEx V6 dataset represents 7051 tissue samples from 44 tissues of 449 donors, and a total of 6 billion data points.
GTEx eQTLs in the Ensembl Browser
To view GTEx eQTL data for any gene, navigate to the gene tab and select ‘regulation’ in the left panel. The display will show one example track of GTEx data for a single tissue. Configuring the page allows you to add more GTEx tracks for each tissue type, by selecting ‘other regulatory regions’ and choosing the tissues you are interested in:

The SNPs are displayed in a Manhattan plot on these tracks, and are coloured according to their consequences on the transcript – as determined by the VEP. Clicking on any of the variants will display correlation statistics and a link to the variant tab. Where the SNPs are clustered, clicking will bring up a list of all variants nearby:

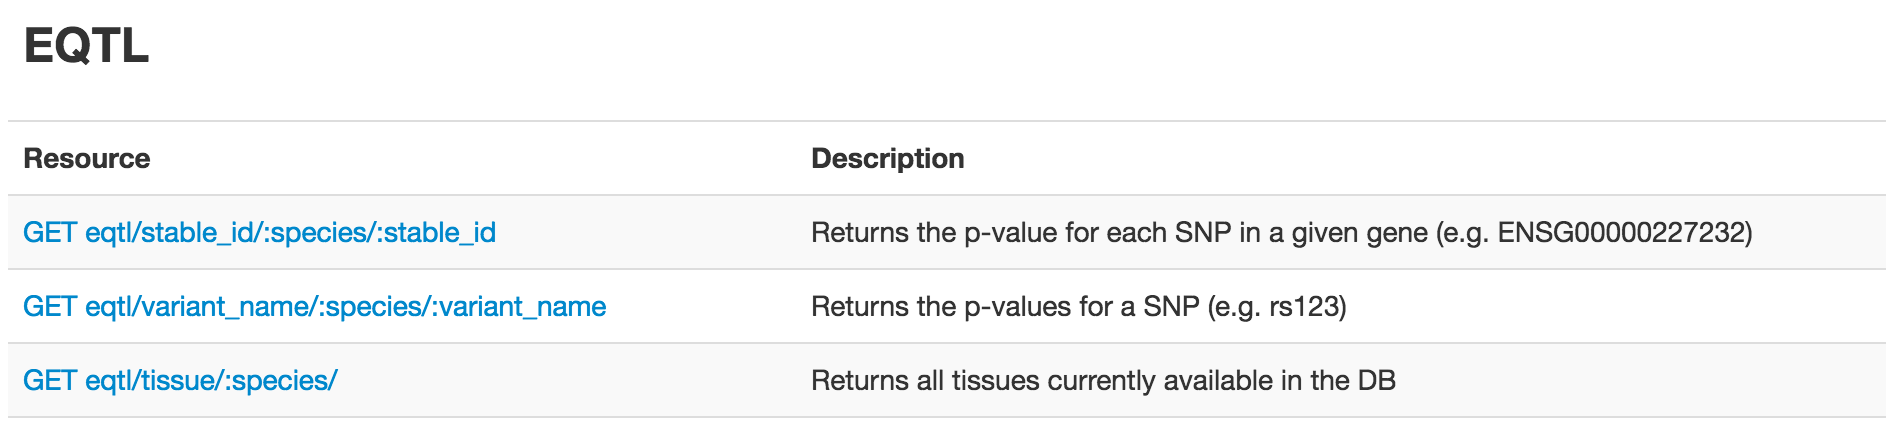
GTEx eQTLs via REST API
We have also provided Ensembl REST API endpoints to access these data. Currently, these methods allow you to quickly find the beta correlations and their p-values filtered by gene, SNP and/or tissue. You can also list all the tissue types that are currently available on our server.
What’s next?
Currently we are displaying the variants around a gene and their correlation to its expression level. In our next release (e86), on the Variant view, we will display all the genes whose expression levels are correlated to that variant. We will also display the beta effect sizes on the Manhattan plots.
If you have any feedback or questions relating to eQTLs in Ensembl, please contact the helpdesk.